The Berkeley Police Department has launched a new online “transparency hub” to make it easier for the public to learn about officer uses of force, police stops and calls for service, along with other crime trends.
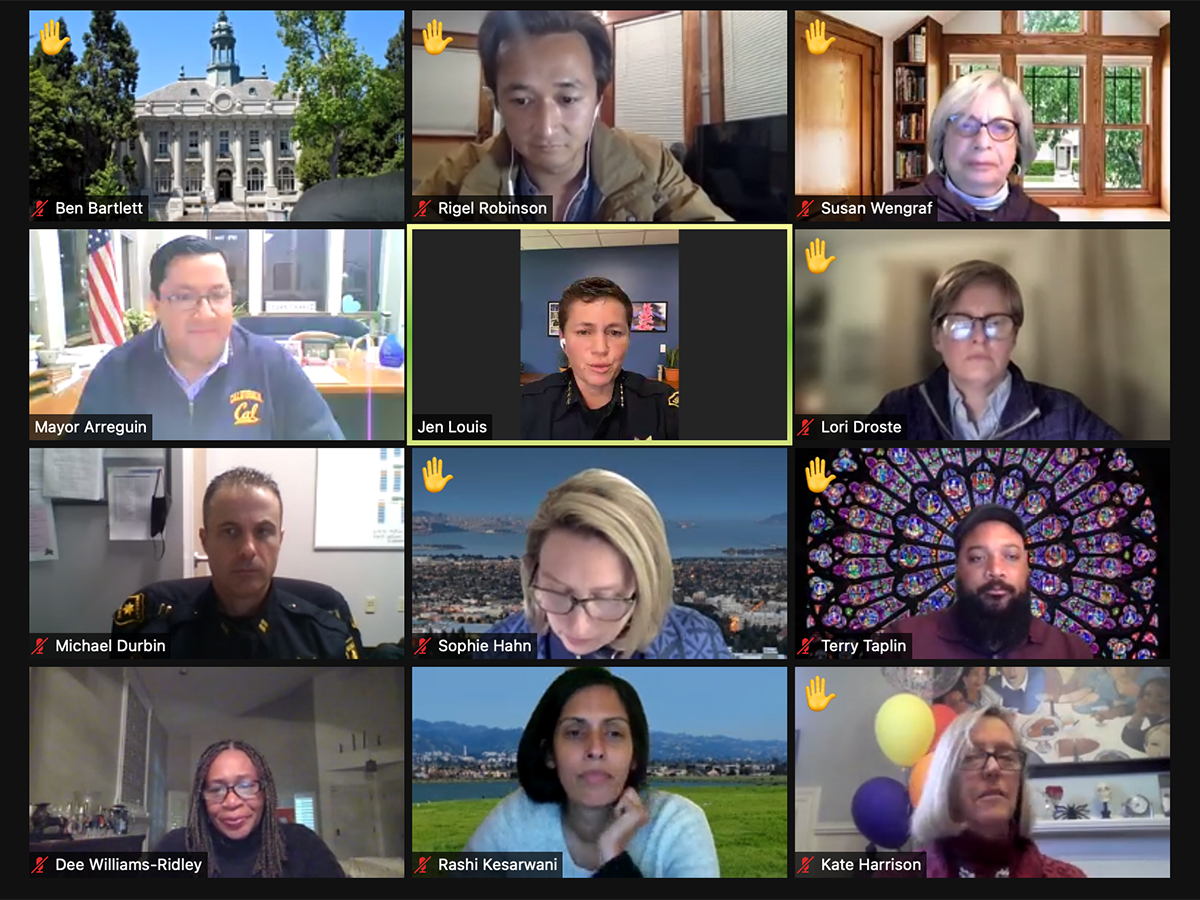
Interim Berkeley Police Chief Jen Louis said the idea behind the website, which went live last week, is to make Berkeley police data more timely and transparent than it has been before.
BPD hopes the new website will “promote trust and accountability with the communities that we serve,” said Arlo Malmberg, BPD data and policy analyst, in a video walk-through of the site that’s designed to help users get their bearings. “Data is just one part of that equation, but I do think it provides an interesting window into how the department operates.”
Last year, Louis set up a two-person data team — analyst Malmberg works in collaboration with a BPD officer — to get the project done and assist with the department’s other data needs.
The new website updates daily, and users can export much of the data into spreadsheets if they want to crunch the numbers themselves. Data are presented in a snapshot form followed by more granular dashboards, which have a number of interactive tools and elements.
BPD use-of-force data is now available
For the first time, via the new website, the public can view a range of data about police uses of force, including the number of incidents, number of officers involved and the level of force, as well as maps that show where the incidents happened.
“Our deepest goal is to facilitate a conversation with the community about crime priorities across the city and use the information to facilitate problem-solving,” Malmberg said. “Data can inform good policy, but only if we have honest and personal conversations about the content and context of the numbers.”
The snapshot interface allows users to review the past 30 days of data as well as year-to-date statistics, and see how the numbers compare to the same period last year.
In 2022, for example, the department has so far tallied 141 incidents, involving 150 subjects, where police used force. Most of the incidents were classified as Level 1 force, which involved neither injury nor any complaint of pain. Level 1 uses of force are up 8% this year compared with last year, while the more serious uses of force have all trended down, according to the snapshot.


(Each officer who participates in a use-of-force incident, and each level of force they use, is counted separately by the city, which is why officers involved and total uses are much more numerous than total incidents or subjects.)
Further down the page, the dashboard shows percentages by subject race, force severity and the primary reasons force was used. Filters allow a closer look at several factors as well as the selection of the preferred date range. There’s also a panel showing whether alcohol, drugs or mental instability was a factor in the interaction.
Note: A portion of the incidents involved more than one level of force used, which is why the percentages to the right don’t add up to 100%
According to the data, 70% of the use-of-force incidents this year involved level 1 force and 42% involved level 2 (when an officer points or “deploys” a firearm, or when there is “more than momentary discomfort” but no resulting injury or complaint of pain).
Thirteen incidents (about 9%) involved level 3 force (“the use of a weapon, subject injury, or complaint of pain”). The most common uses of Level 3 force were takedowns and control holds. In these incidents, 46% of the subjects were white, 31% were Black, 15% were Hispanic and 8% were bi-racial. Two of the incidents involved people who were mentally unstable and seven involved drugs, according to BPD data.
This year there have been no level 4 incidents, such as a police shooting or in-custody death.
In 2020, the City Council approved more stringent use-of-force reporting rules for Berkeley police, which went into effect last year. That’s when BPD first shared use-of-force data as part of its annual crime report. Now, the new police data website makes it more accessible still.
“The idea is you can get a good sense of what is going on in Berkeley in terms of use of force with just the click of a button instead of having to wait for an annual report, or go through the trouble of downloading the publicly available raw data,” Malmberg explained in the video overview. “Now you can just get it all right here.”
Easier now to see calls involving mental health, homelessness
Pages related to police stops and calls for service follow a similar format to the use-of-force information: There’s a snapshot focused on high-level numbers with an easy way to compare year-to-year statistics, followed by a dashboard with more granular filters and settings.
In the calls for service snapshot, users can look at whether calls had a mental health or homelessness component. (Last year, the city auditor’s office urged BPD to track that information better, which BPD said it would do.)

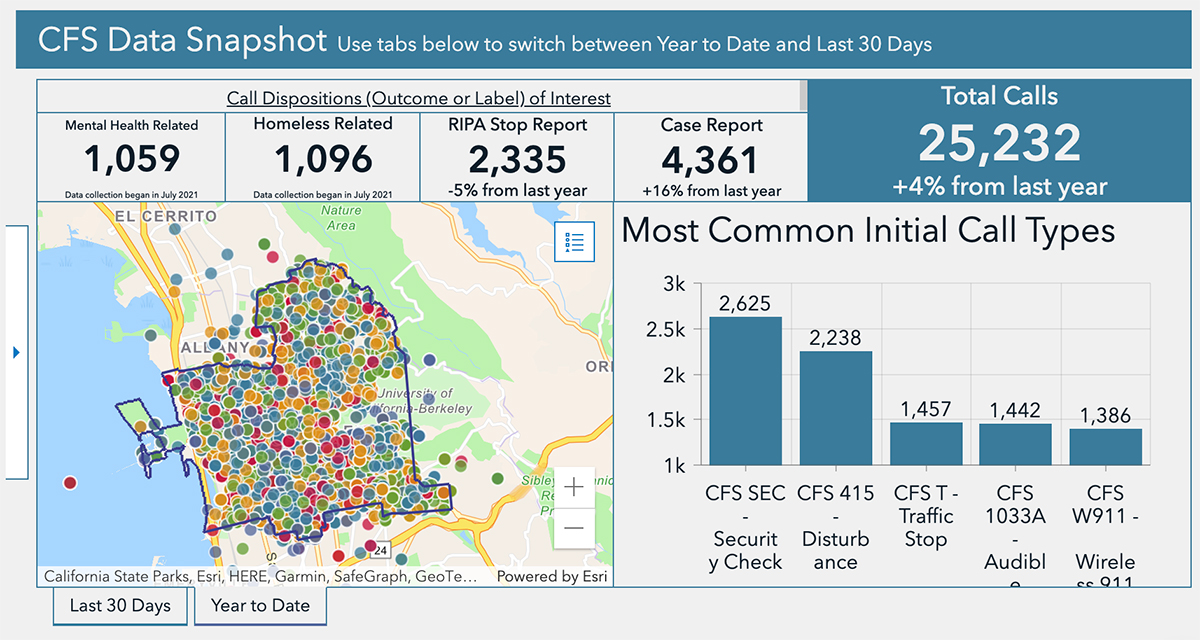
According to the calls for service snapshot, BPD has had about 25,000 calls for service this year, a slight increase over last year. Those calls have resulted in nearly 4,400 case reports, up 16% over last year.
About 1,100-2,200 of the calls for service were related to mental health, homelessness or both, according to the hub. (It wasn’t clear from the snapshot how much overlap there might be between those two categories; Berkeleyside has asked BPD for clarification.)
Further down all three pages, the dashboard interface includes menu options that let viewers place council boundaries and police beats on the map. There are also selection tools for those who wish to see calls or incidents around a certain location, such as their home or work. Using the selection tools adjusts the interface to show numbers from only the chosen area.
“We wanted to make it as easy as possible to dig into,” Malmberg said.
New crime map is still in the works, BPD says
Before the launch of the new website, BPD’s crime map was one of the main public ways to see high-level data about crime reports and trends in the city. But the map has become increasingly glitchy and is often missing data. The department is responsive to requests for updates when the map has problems, but the existing system is cumbersome.
To address those issues, BPD is now working on a new crime map, which it says will be added to the data website when it is complete.
That means those who hope to find basic information about crime reports in Berkeley will still need to rely on CrimeMapping.com for now.
Crime reports and calls for service are different. See BPD’s 2021 annual crime report for the most crime recent trends.
It’s worth noting here that calls for service are preliminary reports that may rely on sketchy, unverified information. As such, they are highly subject to change and may not actually indicate a crime.
After officers respond to a call for service, they determine whether a crime occurred and what the crime was. It may be different from the original call for service. The updated disposition, following an officer’s review, is what shows up on the crime mapper.
As per the transparency hub, about 18% of Berkeley’s calls for service this year resulted in a case report documenting a crime or, less often, another incident type such as a loud party.
Police are stopping fewer people in Berkeley
Even without a crime map, the new data website features a broad array of data and statistics for the public to chew on.
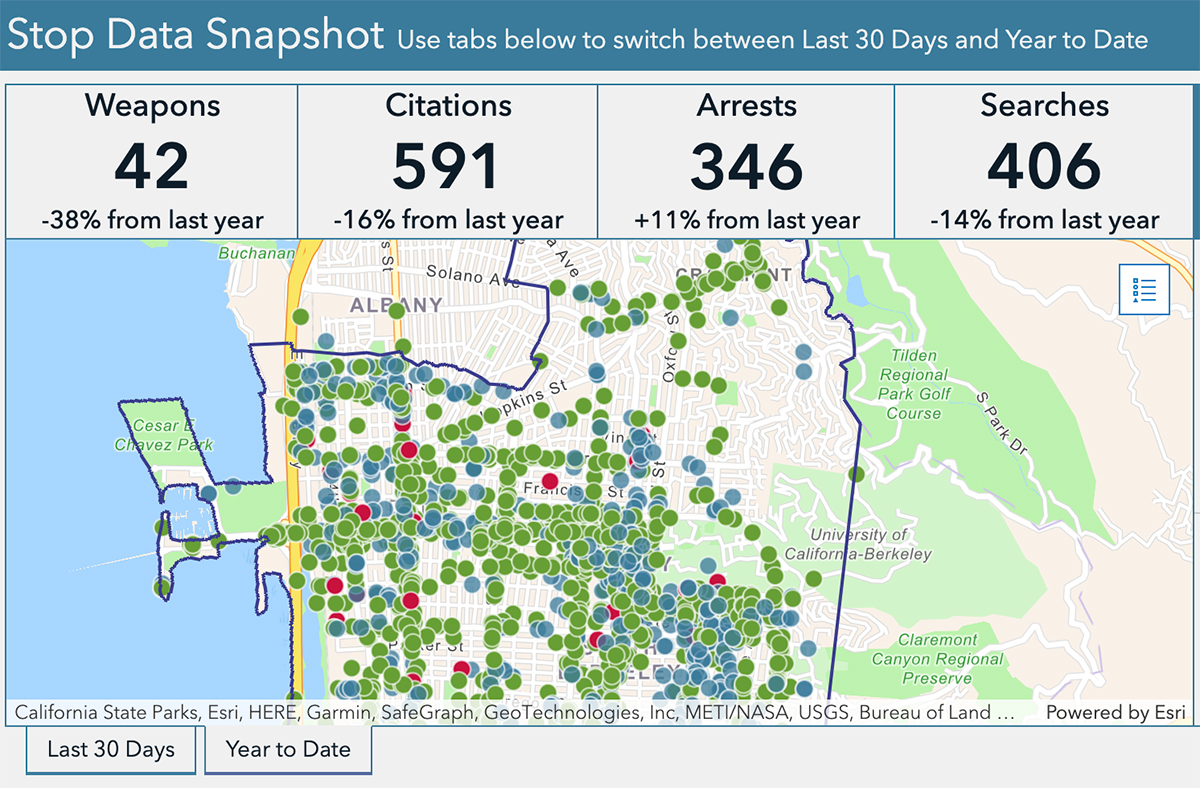
In the police stops snapshot and dashboard, users can see that there have been about 2,200 police stops in Berkeley this year, down 13% from the same period in 2021, and that both searches and citations are also down. Arrests are up 11% over last year.
This year, police conducted searches 18% of the time they stopped someone. They found contraband more than half of the time they searched.
Traffic violations and reasonable suspicion provided the rationale for nearly all of the stops, according to BPD data.
The data also show that 67% of the people who were stopped in Berkeley this year were from Berkeley, 8% were from Oakland and 4% from Richmond (the rest are listed as “other”).
White and Black people each made up about 34% of the people stopped, followed by Hispanic (16%) and Asian (7%) people.
In recent years, the city and department have been working to address the overrepresentation of Black people stopped by police via a collaborative effort organized under the banner of fair and impartial policing. A large part of that effort has focused on reducing the number of police stops in the city.
In a nod to the high level of community interest regarding the racial disparities in police contacts, the stops page has an additional section that offers an even deeper dive into three areas: stops by race, a yield rate comparison (how often stops of people of different races yield contraband or result in citation or arrest) and the effect of the “veil of darkness” (whether the proportion of stops by race changes when it is light versus dark outside).
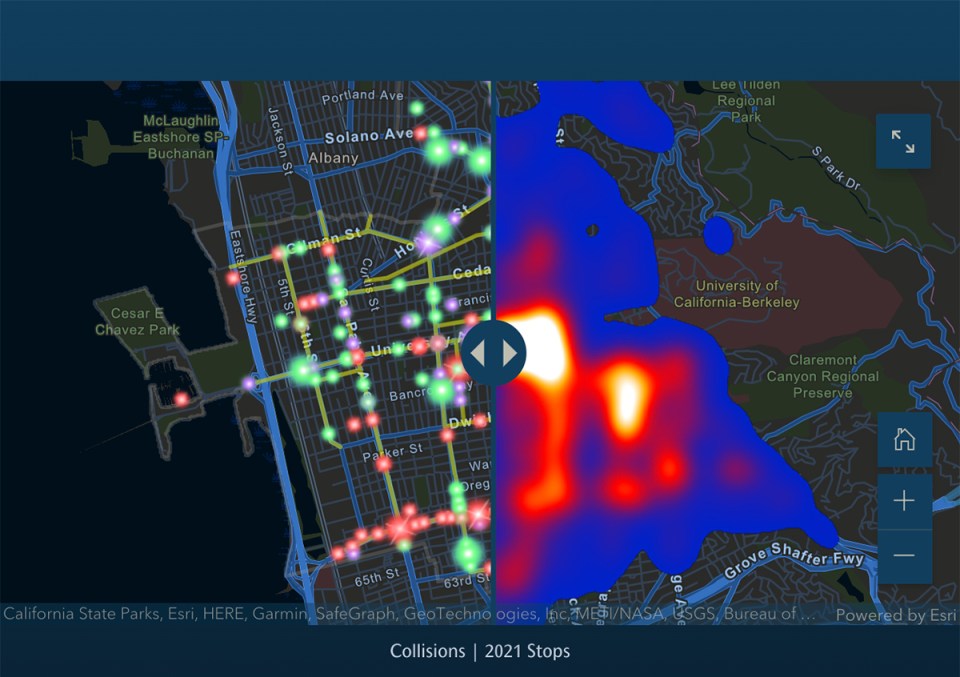
Another map looks at how pedestrian, vehicle and bicycle fatalities from the past 10 years compare to a heatmap of police stops.

Various filters allow users to drill down into different aspects of the advanced datasets to see stop outcome (arrest, citation, no enforcement or mental health hold) whether there was a search, the traffic violation type and the stop type (if the person was on foot or in a vehicle).
Yet another page on the new website features data going back to 2016 related to several recent crime trends: a tally of alleged hate crimes and hate incidents in Berkeley, the number of guns seized by BPD (including ghost guns) and statistics about stolen catalytic converters. BPD says it plans to update the trends page in response to issues of community interest.
“We want to hear from you about what issues concern you most,” Malmberg said in the walk-through video. He said the page would be a “living document that we’ll be updating and changing as we get feedback.”
To make it easy to provide input, a survey link appears at the foot of each page.
“At the end of the day, transparency is a question of equity: Who has access to data?” said Malmberg in the video. “We want to make sure it’s not just folks with time and highly specific skills that are able to download raw datasets and interact with these data.”
Featured photo: Emilie Raguso